In terms of trading, a flag refers to a price pattern observed for a shorter duration; keep of time and moves side-by-side to the ongoing price trend, which is kept for a more extended period. The primary objective of such patterns is the identification of previous trends in comparison with the current price and the study of the deviations.
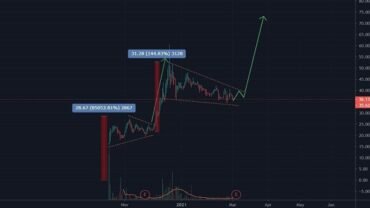
The flag chart pattern is broadly divided into three parts. These are the first pole, the flag’s formation, and the second pole. A breakout pattern and higher volumes characterize the first pole. Following this part is the formation part, where there is a slight dip in the volume. Then, the height is almost equal to the first pole in the second pole. Such patterns are vital tools that help forecast the trading market scenarios. So, let us understand the functioning and the process of such a pattern for a successful trade.

Functioning of Flag Patterns
The flag patterns can be of two types – upwards and downward trending. Such trends correspond to bullish and bearish flags. The whole pattern usually consists of about five to twenty price bars. Flag patterns reflect four different characteristics. These are listed as follows:
Preceding Trend
- Consolidation Channel
- Volume
- Breakouts
- Price Confirmations
Both bullish and bearish patterns indicate similar structures but differ in direction and volume pattern. The volume pattern is higher than previous trends in the former and gradually declines during consolidation. However, the bearish volume pattern increases in the first stage, then comes to a hold level. This is because the volume tends to increase in such markets.
Understanding the Process of Trading a Flag Pattern
A trader must identify three crucial aspects for ensuring a proper trading plan in these flag patterns charts- the entry, stop loss, and profit target.
- Entry
Flags usually show that the current trend keeps on continuing. However, it is essential to wait for the breakout to avoid a false signal. Post the price has broken and closed above the upper parallel trend line when traders step into a flag. In case of a bearish pattern, traders are expected to come in a post the price has closed below the lower parallel trend line.
- Stop Loss
The opposite end of the flag pattern is considered the stop-loss point for traders. The traders need to keep in mind that if there are sloping parallel lines of the flag, the entry will be dynamic (keep on changing) because the lines slope over time.
- Profit Target
The best way for trading in the pattern is during the breakout. Forecasting the breakout direction is a skill that the traders develop over time. Profit targets are primarily set upon two methods-
1. Conservative
For ascertaining a set target for profits, the conservative traders use the price difference. The difference in the falling wedge pattern parallel trend lines is checked for this purpose, which generates a quick profit.
2. Aggressive
In this approach, the traders have to wait for the market to hit, which is whyit’s a lengthy process. However, one key benefit of the aggressive method is that it generates more significant profits.
Apart from these three key points, the target needs to have detailed knowledge about the position size choices. Traders must be cautious and check the market trends to ensure they succeed in using flag patterns for making their way through trading strategies.
Conclusion
Such patterns are the ideal ones for swing trading. However, the problem associated with trading flags is false breakouts. These patterns must be used for foreign exchange trading when the market fluctuates. In the case of trade or stock futures, it must be traded based on the forecasting at the most active times of the stock market.
Santosh Kumar is a Professional SEO and Blogger, With the help of this blog he is trying to share top 10 lists, facts, entertainment news from India and all around the world.